
OpenFOAM
- 2020/08/07
We use Valgrind with callgrind to debug and profile OpenFOAM solvers in order to give out solutions to make our modified solvers run faster and get more stability. We can even generate nice looking call graphs to help us trace function calls or compare the consuming time of functions between different versions.
1. Valgrind Installation on Ubuntu terminal
- First install the KDE environment [https://itsfoss.com/install-kde-on-ubuntu/]
sudo apt-get install kde-full
- If you get the message that some packages not found then try again :
apt-get update
- Installing Valgrind with the following command
apt-get install valgrind
- Installing Kcachegrind for profilling
apt-get install kcachegrind
- Note: When you open Kcachegrind, you do "File -> export graph" and the images are not created and you just get the source code behind, then install one of the packages suggested in the terminal output messages like google chromium. Otherwise skipping this step.
sudo apt install evince
- If you still get just the code and no flowchart image then try to enter the following commands, otherwise just ignoring commands below:
sudo apt install chromium
sudo apt install chromium-browser
sudo apt install google-chrome
sudo apt install links2
sudo apt install elinks
sudo apt install links
sudo apt install lynx
sudo apt install w3m
2. How to use Valgrind
- For serial run
valgrind --tool=callgrind <executableName>
- For parallel run
mpirun -np $nProc valgrind --tool=callgrind <executableName> -parallel
3. KCachegrind basic
- Call Lists: These lists show calls to and from the current active function. All callers and All Callees are meant those functions reachable in the caller and callee direction, even when other functions are in between. It includes Callers, Callees, All Callers, All callees
- Maps: For the caller Map, the graph shows the nested hierachy of all callers of the currently activated function; for the Callee Map, it shows that of all callees
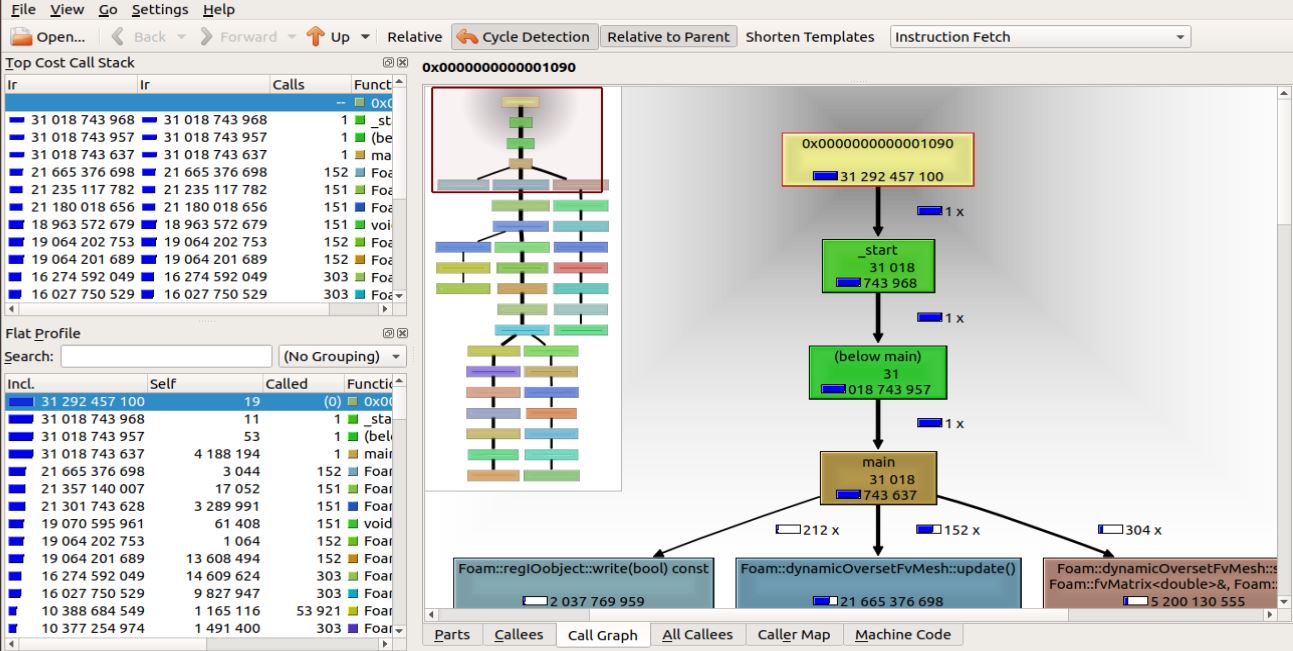
- Call Graph: this view shows the call graph around the active function. The cost shown is only the cost spent while the active function was actually running. For cycles, blue call arrows indicate that this is an artificial call, which never actually happened, added for correct drawing.
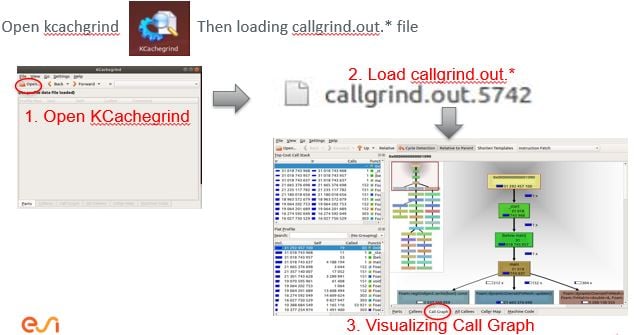
4. Using Kcachegrind to profile overPimpleDyMFoam
- Running overPimpleDyMFoam with valgrind --tool=callgrind by entering the commands below
valgrind --tool=callgrind -v --dump-every-bb=10000000 overPimpleDyMFoam 2>&1 | tee log.overPimpleDyMFoam
- At program termination, a file callgrind.out.* will be generated, which can be loaded into KCachegrind.
The image below is an example for comparing the calculated time of child functions of overPimpleDyMFoam with other versions: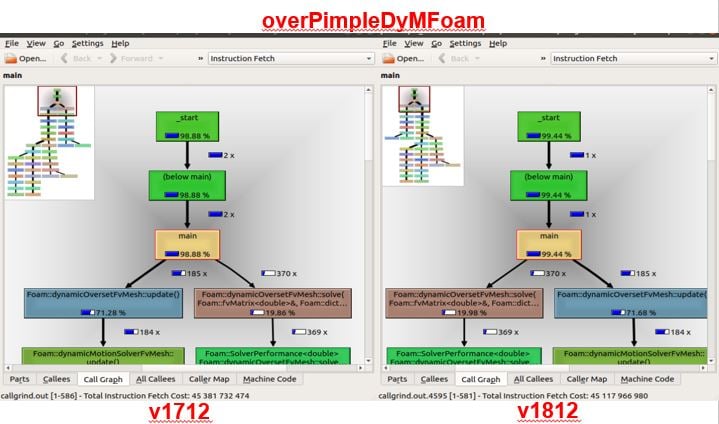
For the image, considering the executable time of overPimpleDyMFoam, we can see the function named Foam::dynamicOversetFVMesh::update() of OF1712 took 71.28% of time consumption while the counterpart of the right side is slightly bigger than 0.08%, standing at 71.68% of time consumption. This example shows that the various spending time of the same solver between other OpenFOAM versions can be detected by Valgrind
5. Reference
[1]. Josef Weidendorfer and Federico Zenith, "The KCachegrind Handbook"